Customer Support for Software Engineers — Part II
Measuring, estimation, and people allocation towards SLA/SLO
If you just arrived here, make sure to check Part I of this series where I talk about how to manage production defects after (and before) releases.

SEM Blog | Customer Support for Software Engineers — Part I
This part covers the measurements that are important for engineers to manage their process and understand how to establish Service Level Objectives (SLO), how to allocate people, and where to optimize the processes to improve SLO adherence. Part I focuses on practices often overlooked by organizations that are fundamental for the success of the customers.
Four core measurements
From my experience managing teams, as a developer, and as a customer support agent, I know many measurements can be collected to provide insights into the performance of the incident management process.
From all those, I suggest four core measurements to establish how to reduce the time to resolve an incident.

Total Time per Incident
Total time is calculated from the moment the incident is reported until the incident is resolved. It’s the time that matters to the users. Service Level Agreements (SLA) usually contain Service Level Objectives (SLO) based on that. Sometimes, customer support’s time waiting for the user to answer may be excluded depending on how the SLO was designed. The SLO will be the sum of the running time and the waiting time of all teams. If the organization has defined an SLO lower than this sum, the SLO was defined beyond the organization’s capacity and must be renegotiated until the process’ performance is improved enough. In the next section, I’ll explore how to estimate this.
Running Time per Team
Running time is the time spent by the team working on the incident. It is the total time minus any time waiting for another team and minus the time waiting for the customer. Support teams sometimes may have to go to engineering teams for questions to be answered, and the support team may discount their waiting time. This running time deserves a different treatment from the waiting time because, during this time, work is being done. Improvements to how we do the job are needed to reduce this time.
Waiting Time per Team
The waiting time is when a team is waiting on another team. It’s the total time minus the running time per team minus the time waiting for the customer. This time deserves different treatment from the running time because to reduce it, we don’t have to change how we do the work, but to priorities, people, and resources availability.
Effort
The effort is the sum of the time spent by each person involved in closing the incident. The best way to do it is to group by the performed role (Customer Support Agents, Product Owners/Managers, Engineers, etc.). This measurement is crucial because it allows computing how much an incident cost and how many people it requires. Determining how many people are needed is an essential component. It helps define if (and how many) people from each role might have to be on stand-by or allocated directly to deal with incidents.
Effort Estimation and SLO’s

SLO’s are negotiation points between parties with conflicting interests. On one side, customers want times to be shorter, and they have an acceptable limit, beyond which they won’t agree with the SLO. This limit is called the “voice of the customer.”
For the organization, the process performance may not deliver results in short enough time, no matter how many resources are applied, no matter how many people are allocated (9 pregnant women don’t make a baby in 1 month). In this case, the organization needs to improve the process first, and these improvements may take a while to yield the necessary results.
These limitations from the organization determine the “voice of the process.”
So ultimately, establishing a viable SLO requires understanding what the customers need and what the organization can deliver.
SLO Estimation
Gather the total time per incident from a number of incidents. Note that questions may take significantly less time to resolve than incidents that require a workaround or a defect fix, so you may want to do this analysis separately for each category (and possibly negotiate different SLO’s for questions).
A good number to start with is around 30 incidents, but you can begin analyzing sooner to get acquainted with the process. The more incidents, the better.
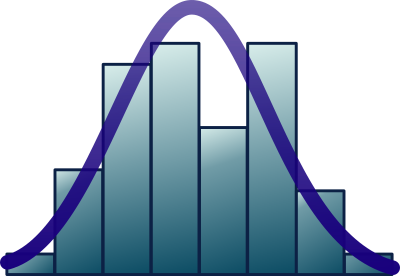
Let’s say you have one incident that took 10 hours to be resolved. You will plot your first bar with value 10 and height 1 (one incident). If you have 5 incidents that took about 50 hours to be resolved, you will plot the second bar with a height of value 50 and a height of 5 (five incidents). This is the process of building a histogram, like the one below. The expectation is that there will be a higher number of incidents around the center. If you find two or more clear peaks, be assured that unknown factors influence these incidents, and you should identify them and break them into different groups.
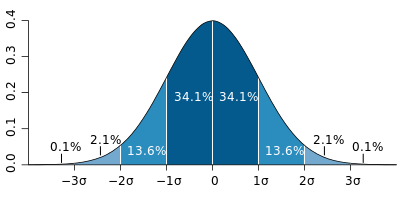
The center of the chart will point towards the average time. Many people fall into the mistake of taking the average of the time to stipulate the SLO. However, in a normal distribution, half of your incidents will fall below the average (that’s when you deliver within the SLO), and half will fall beyond the average (violating the SLO). The chart below shows the percentage of incidents between the average and ± 1, 2, and 3 standard deviations from the average.
I’m sure you don’t want to violate the SLO half of the time. You cannot promise that you will NEVER violate the SLO, as unforeseen circumstances might happen. So you need to propose an SLO in two parts: the value (in this case, the time under which you will resolve it) and how often it’s ok to violate it to account for these edge cases. The two things go together, and the way to calculate it is to sum the values in your histogram. This is called the “cumulative function,” and you can calculate it by looking at each bar in your histogram and summing the count (frequency) of that bar to all bars to the left of that one. You will have a chart that looks like this (a Sigmoid function):
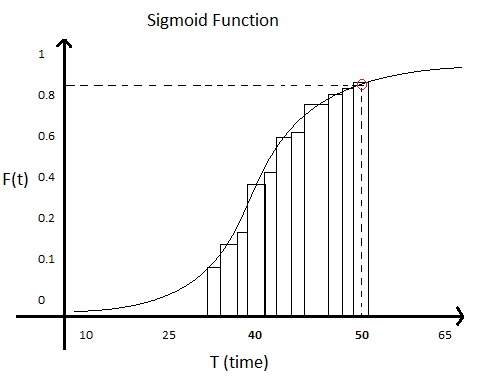
On the x-axis (bottom), you have the longest time that group of incidents took. On the y-axis (left), you have the number of incidents that can be resolved with that amount of time or less. For each bar, divide the number of incidents by the total number of incidents and multiply by 100 to get a percentage.
If you look at this chart, there is a point signaled in red. For the sake of this example, that point tells you that if your SLO is around 50 hours, you will be able to resolve a little over 80% (maybe 85%) of your incidents, which means you can expect 15% of the incidents to violate the SLO. Choosing the value will depend on how much your customer can accept.
Defining anything different will not help the organization achieve the SLO. The process needs to be improved to influence the Running Time per Team and the Waiting Time per Team.
Ignoring this is dangerous. The immediate impact is that a higher percentage of violations will happen, frustrating customers and causing damage to the organization’s image. Once that starts happening, Customer Support Agents will pressure Engineers to deliver a performance they can’t, building a chasm between parties that should be working together.
Effort estimation
Many people think that your SLO will determine how much effort you will allocate to incidents. That is only true if you don’t have an objective to resolve all the incidents.
Saying that 85% of the incidents will be resolved within a certain amount of time doesn’t imply that the remaining 15% won’t be resolved. Efforts will have to be employed to carry these incidents to resolution.
It is important to understand how many incidents are reported per sprint (or any other period) and allocate the number of people in each team to resolve them. That’s why the effort has to be calculated per team.
I’ve seen teams employing multiple strategies, like allocating a fixed number of people per sprint to deal with incidents or allocating a certain percentage of time (or reserving part of the velocity) to deal with high-priority incidents that might have to be addressed during the sprint.
In any case, it is essential to consider factors that influence the rate at which incidents are reported for this effort estimation to work. For instance, incidents will be reported on the same day or a few days after a release in many organizations. Suppose the organization allows customers to test the system before release (User Acceptance Test or Beta Test). In that case, an increase in the number of reported incidents is expected during this period.
Therefore, sprints that happen during or immediately after these factors will likely be affected by the incidents being reported. When you calculate the effort needed for each team, consider these factors and estimate what is required in different scenarios.
Note that this only means that engineers allocated to handle incidents will prioritize incidents, and some lower-priority stories may not get done. If incidents are reported at a lower rate, engineers should apply the effort towards the sprint goal.
Make sure to check Part I of this series, where I talk about how to manage production defects after (and before) releases.
SEM Blog | Customer Support for Software Engineers — Part I
If you like this post, please share it (you can use the buttons in the end of this post). It will help me a lot and keep me motivated to write more. Also, subscribe to get notified of new posts when they come out.