Seven Estimation Techniques for Software Engineers
Understand what level of estimation maturity your organization adopts and some alternatives for improvement
Disclaimer: I’m saving the best for last!
Do you know that situation when someone asks you for an estimate, “just high level, so we can have an idea” and then it becomes a commitment to deliver on a deadline? The last one may actually save you from it.
Expert opinion / Delphi
The simplest and least accurate estimation technique is “just ask someone.” Referring to a Subject Matter Expert (SME) is the easiest thing to do. However, the team might not perform how the SME believes they might. It starts to get better if you ask more people, especially those who will execute the job. While it’s still their opinion, it’s easy, simple, and not very accurate. Divergences are expected.
At this point, Delphi is a simple technique to build convergence: Ask them to take notes without communicating with each other and then share with them each other’s results. Ask them to explain their perspective and try again. After very few iterations, the estimate is expected to converge. Does this ring a bell?
Planning Poker is Delphi with discrete predetermined values on cards.
This is the easiest estimate because it requires the least information available. For the same reason, it’s the least accurate. Because it requires less information, it can be applied to earlier stages of the project or initiative.
However, if it’s too early in the project, you must provide estimation ranges to account for variability. It’s going to save you from a lot of trouble later. My recommendation is to widen the range as the estimate gets higher.
Many people like to use T-Shirt sizing at earlier stages. I’ll give an example of T-Shirt sizing associated with widening ranges. I’ll use a 2 weeks Sprint as a reference. You don’t have to use Sprints; any measure of time will do.
| T-Shirt size | Estimate | Range size |
|---|---|---|
| Extra Small (XS) | Less than half Sprint | 1-week range |
| Small (S) | Up to one Sprint | 2-week range |
| Medium (M) | From 1 Sprint to less than 3 Sprints | 1-month range |
| Large (L) | From 3 Sprints to less than 11 Sprints | 2-month range |
| Extra Large (XL) | 11 Sprints or higher |
Analogy
Analogy estimation is almost as simple as asking SMEs about it, but they are required to compare the work being estimated to work done in the past. This takes into consideration the team’s performance with greater accuracy. Does this ring a bell?
Story points are analogy-based estimations.
Analogous with Delphi
I believe this is the de facto industry standard practice. We ask the SMEs to compare to previously completed work to estimate by analogy. Then we implement Delphi by sharing their individual results simultaneously and asking them to justify their estimates if they are discrepant. Then we take another round at the estimation by analogy.
This is what teams do when estimating story points with planning poker. That’s why it is more reliable than asking an SME to estimate the work for an entire project or feature on behalf of a whole team (or teams).
Three-point / PERT + Expert / Delphi
While story points and other measures may be suitable for smaller tasks, providing an initial high-level estimate may be handy in some situations. Even if you have small tasks but don’t have enough information yet, you may want to try this exercise. Ask your SMEs to provide three estimates instead: low boundary, most likely, and high boundary. You can even use Delphi to do it with a group. This will allow you to start conversations and set expectations among stakeholders.
The PERT technique is a mean calculation that favors the most likely scenario based on a three-point estimation. This should be used with caution. I recommend using it to simplify conversations, not as an estimation. This formula is also known as “beta distribution”: (lowest value + 4 X most probable + highest value)/6
Be careful with multiple 3 point estimations in the same initiative. You can’t sum all the lowest and highest values and expect them to be your variation range. The more estimations you have within the initiative, the less likely it will be that all of them will be executed at the minimum or maximum. It’s not going to work like that in reality. If you need to combine them, I suggest you look at the last estimation technique in this list, which involves simulations. I’m even sharing a Google Spreadsheet with an example.
Historical data
If you have historical data, you can build control charts like those described above. In my opinion, it seems to be the most reliable way to estimate as it takes into consideration what you know about your team’s performance. Check the links in this session for examples of how to use historical data.
Parametric models
Parametric models take into account parameters based on the characteristics of the work being estimated. One of the most famous parametric models for estimation in Software Engineering is Function Points.
It is maintained by the International Function Point Users Group (IFPUG) and has been published as an ISO standard. IFPUG also maintains other measurement models that can be used for estimations, such as SNAP (for non-functional attributes) and SFP (a simplification of Function Points).
Another interesting model that is based on Use Cases is the Use Case Points. It’s much easier to use than Function Points. However, it requires a greater level of detail (use cases).
Many companies adopt their own parametric models when they leave Story Points behind. They analyze the correlation between attributes of artifacts they build with the effort dedicated to building them and use these correlation factors as weights. An example would be to use the number of elements in a screen to estimate how long it would take to build it. In my opinion, because it is more specific to the organizational context, tied to how the tools and technologies are used, this tends to be more accurate and better understood.
Monte Carlo Simulation over Triangular Distribution
Monte Carlo simulation is a simulation based on random values being generated and applied to estimations to understand the project’s behavior.
Remember in the beginning when I told you this one could save you from providing a high-level estimate that becomes a commitment? Well, this one is easily applicable for scenarios where you don’t have a lot of details and allows the conversion of an estimation range to a single value. However, you won’t tell them what the number should be.
You will tell them the range, and the risk of picking any number in between, let them choose, and let them assume the risks! ;-)
If you are interested in improving your high-level estimation accuracy, I’ve written a post with questions that can be answered at that stage that will help you having a better idea of what the effort might look like.
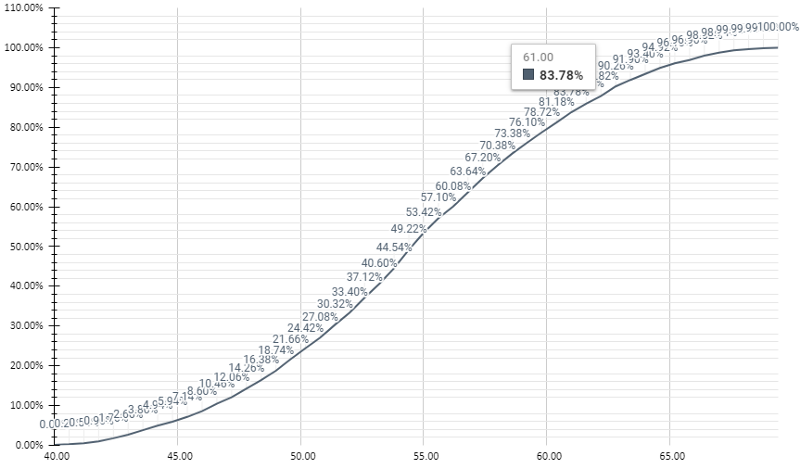
As an example, assume that you have a three-point estimation for an epic. You expect the epic to take somewhere from 40 to 70 days, 55 days being the most likely value. You may be asking yourself where you should take these values from. Take a look at the previous techniques in this post. You can use any of them. ;-)
Monte Carlo simulation will allow you to convert the three-point estimation into a Triangular Distribution, run random scenarios, and answer the question: What is the risk of it taking longer than, let’s say 61 days? Or similarly, if I want to have 83% certainty that I won’t go over the estimation, what should the number of days be?
Why 83%? If you try to guess the number on a 6-faced dice roll, the likelihood of failing is around 83%, a very relatable bet.
I’ll explain how it works briefly, and then I’ll share a link with a more detailed explanation.
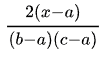
Basically, it calculates the distance between the most likely value and a random value between the lowest and the highest.
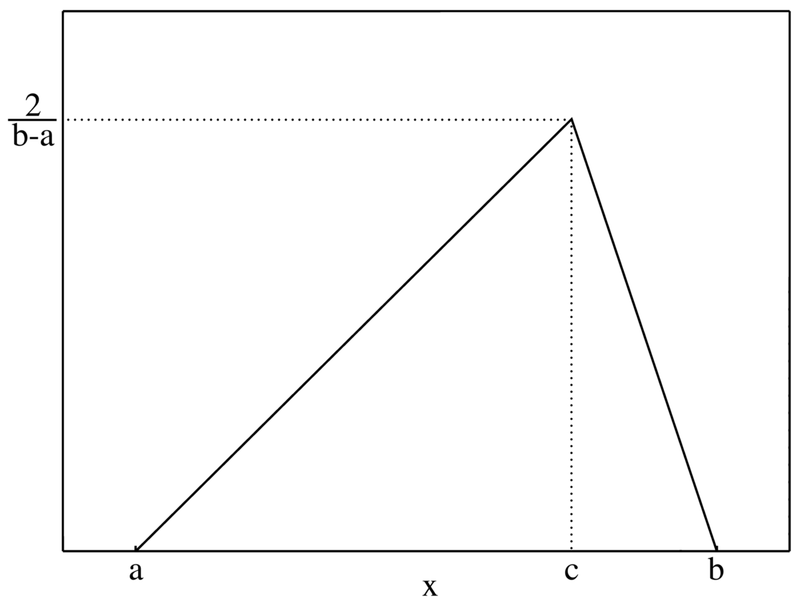
If the random value X is between the lowest “a” and the most likely “c”, we calculate the scenario as:
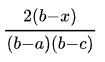
If the random value X is between “c” and the highest “b”, then we calculate the scenario as:
By doing it hundreds or thousands of times we end up with different scenarios that respect that distribution. Then it’s just a matter of counting how often each scenario repeat to figure out their probability of occurrence. Counting all the scenarios with 61 days or less (in our example) and dividing by the total number of scenarios will tell you the percentage of scenarios that would not go over 61 days. That’s the question we want to answer (83.78% is close enough to 83%).
I have actually built a Google Spreadsheet (from where I took the image above) that you can copy and use to do estimations using Monte Carlo simulations as I described. It’s licensed under a Creative Commons Attribution-ShareAlike 4.0 International (CC BY-SA 4.0).
There are many software and Excel plugins that execute this simulation for multi-task projects if you want to use it professionally.
Let me know in the comments which estimation techniques you have used already and what your organization currently adopts!
Cheers!
If you like this post, please share it (you can use the buttons in the end of this post). It will help me a lot and keep me motivated to write more. Also, subscribe to get notified of new posts when they come out.
Extra reading
If you want to learn more about Triangular Distributions, follow the link below:
If you want to learn more about how Monte Carlo Simulations work and how to use them in more sophisticated scenarios, I’ll leave you with these links: