Quantitative Software Quality Management — Part I
Measurements to monitor the effectiveness of quality practices
This is the 1st part of 2-part series of posts showing practical ways to manage QA quantitatively, using statistics. In this 1st part, I’ll focus on monitoring the effectiveness of QA activities. The 2nd part will be about estimating the quality of releases, features, and the resources needed to manage releases post-production.
Make sure to check the Part II of this series, where I talk about measurements to estimate the results of your quality practices.

SEM Blog | Quantitative Software Quality Management — Part II
Measurement and Analysis
Software Measurement is extremely important and heavily misused. People tend to choose measures thinking about the value the measures can bring. However, this is misleading.
In the book “Controlling Software Projects,” Tom DeMarco said, “you can’t control what you can’t measure.” And that’s correct. However, he never said you need to control everything.
Measurement is expensive, and you should only measure things that you have to. It involves a lot of software engineering knowledge, process knowledge, and statistics.
This is a 2-part post series, where I’ll share with you the most interesting QA-related measures I’ve used. The first post will focus on monitoring the performance of QA activities/processes and improvement initiatives. The second will focus on estimation.
Defect propagation
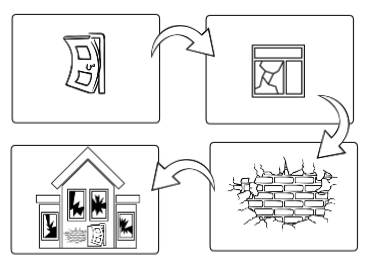
The software development process is knowledge transformation and enrichment. We define a problem and enrich that knowledge with the requirements for a solution. Then we analyze the requirements to transform them into technical specifications that support building such a solution. Next, we develop code that describes this solution to a machine. We then go back to the requirements and technical specifications to design tests that we will execute to verify this code.
Each transformation is done by humans or based on an artifact built by humans. In any case, humans will make mistakes, faults. These faults are wrong information that will go through the transformation process with the correct information to generate the next artifact. It means the faults will propagate from one artifact to the other, accumulating faults in the end.
While there are many strategies to reduce this cumulative effect by identifying these faults earlier (reducing propagation) or even to avoid them being inserted, this post will focus only on the end result. The idea is to measure how good the process is and improve it by looking at the process’s results.
Glossary

I’ll use a few technical terms with precise meanings.
From “Guide to the Software Engineering Body of Knowledge (SWEBOK)”:
- Failure: A failure is said to occur whenever the external behavior of a system does not conform to that prescribed in the system specification. A single fault may cause multiple failures, and multiple faults can result in a single failure.
- Fault: A fault is the adjudged cause of an error. This is the actual, identifiable, human mistake. A single fault or many faults may result in a single failure, no failures, or multiple failures.
- Defect: A defect is a general term that refers to failure or fault. However, a defect will mean a FAULT unless stated otherwise in this post.
From “ISO/IEC/IEEE 15939–2017 Systems and software engineering — Measurement process”:
- Base measure: measure defined in terms of an attribute and the method for quantifying it.
- [[2022-01-04-Quantitative-Software-Quality-Management—Part-I.md]] 2022-01-04-Quantitative-Software-Quality-Management—Part-I.md
- Derived measure: a measure that is defined as a function of two or more values of base measures.
- Indicator: a measure that provides an estimate or evaluation of specified attributes derived from a model with respect to defined information needs.
Identified x Escaped Defects

If you improve your QA activities, this is the number you want to see change. Your Identified x Escaped Defects is a derived measure where you divide the escaped defects by the total (identified + escaped) defects. It gives you a good idea of how good your process is in detecting defects. The larger this number is, the more effective your QA practices are.
An escaped defect is a defect that has been identified after all your quality activities have been executed. This usually means a defect found in production but can also mean a defect found in an environment exposed to clients or users, such as a staging environment or a UAT (User Acceptance Test) environment. When such environments are used, sometimes tests and other quality activities happen on them before access is given to external parties. Once these activities are executed, any defect identified by an external party may be considered an escaped defect.
For this reason, escaped defects are usually calculated per release. However, if a team has different regression test phases (for instance, one with its internal scope and another one with changes from multiple teams on a different schedule), sometimes a team may want to consider the defects they couldn’t identify as escaped.
Escaped defects are a base measure. It’s a simple count of defects.
The identified defects are the ones you have spotted in QA activities during the development process, such as requirement inspections, code reviews, unit, integration, and UI-level tests, regression tests, end-to-end tests, etc. It’s another base measure that you get by simply counting all the defects caught in QA activities. Remember that if you are calculating escaped defects by release, this measure should also be calculated by release.
However, THERE IS A CATCH: The escaped defects are defects in production, which means that the defects that you didn’t identify refer to the past release, not the current. As a consequence, when calculating this derived measure, you should divide the number of escaped defects from the CURRENT release by the number of total defects (identified in the PAST release + escaped in the current release).
To see the improvement in your process, I recommend that you plot a time series with the value (y-axis) per release (x-axis). As your process improves, the values decrease:
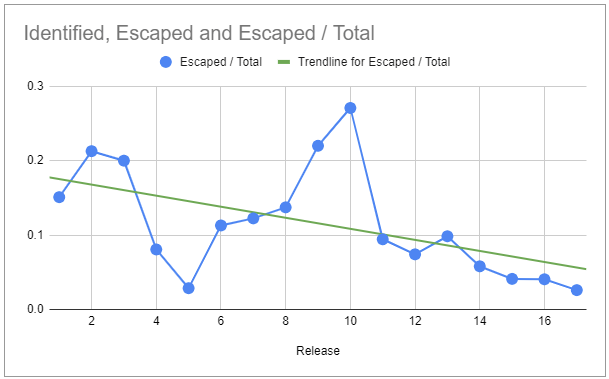
The trendline, in this case, is an excellent indicator of how effective your improvement initiatives have been.
Another interesting way to compare the identified to the escaped defects is with 2 series in a line chart, one for the identified defects per release and the other with the escaped defects per release:
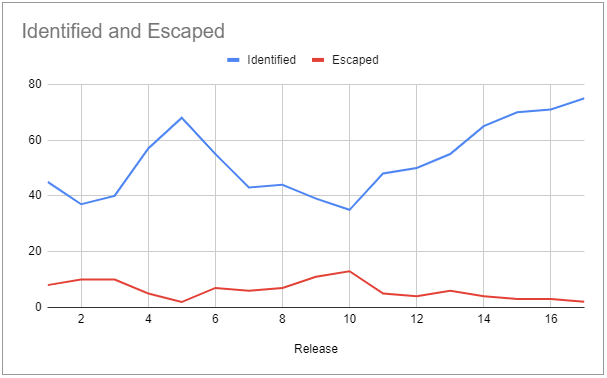
Ideally, if you improve the QA activities, you will see the number of identified defects increasing as the number of escaped defects decreases. It provides a visual representation of the proportion of defects the process identifies compared to those that escape.
The ones that escape will get into your backlog, to be resolved. And then, you will have to measure your ability to resolve defects, which is the topic of the next session.
New X Resolved Defects
Often called New x Closed Defects, this measures your ability to resolve defects. How? It’s a derived measure that compares the rate at which you resolve the defects to the rate at which new defects are detected. When your defect fixing rate (green line below) is higher than the number of resolved defects (red line below), you are closing defects in the backlog. When it’s lower, you are accumulating them.
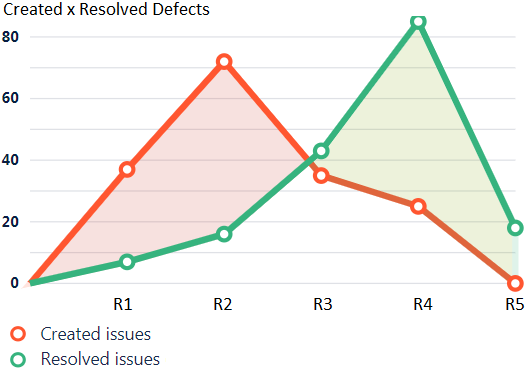
The difference between the 2 will tell you the effort you need to apply to match the rates. When the rates match, your application quality is stable.
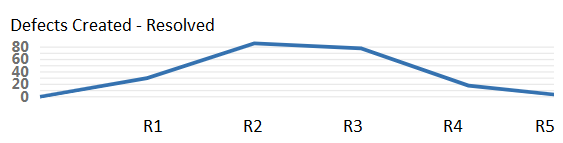
When the creation rate is higher, your application quality gets worse. Even if it’s not enough for your users to note release by release, accumulating these defects will make users perceive your software as “buggy” or having “low quality” in the long term.
This difference between created and resolved is an excellent indicator of how the quality of your system is changing over time.
It is essential to keep these numbers close to each other, tending to resolve faster than creating, to avoid accumulating. However, if you invest more in resolving than you invest in improving the quality of your releases, the trend is that more effort will be needed to fix defects on each release, strangling your organization’s productivity and hurting users’ satisfaction.
If you find your organization swamped by defects, I have posted a very interesting approach to reduce the effort required to resolve defects:

SEM Blog | Fixing Defects in Bulk
Make sure to check the Part II of this series, where I talk about measurements to estimate the results of your quality practices.
SEM Blog | Quantitative Software Quality Management — Part II
I hope you find this useful! If you have questions or suggestions, sound them off in the comments! :-) I’d love to hear from you.
If you like this post, please share it (you can use the buttons in the end of this post). It will help me a lot and keep me motivated to write more. Also, subscribe to get notified of new posts when they come out.